Contingent Hiring Surge: Where the BD Signal Is Now
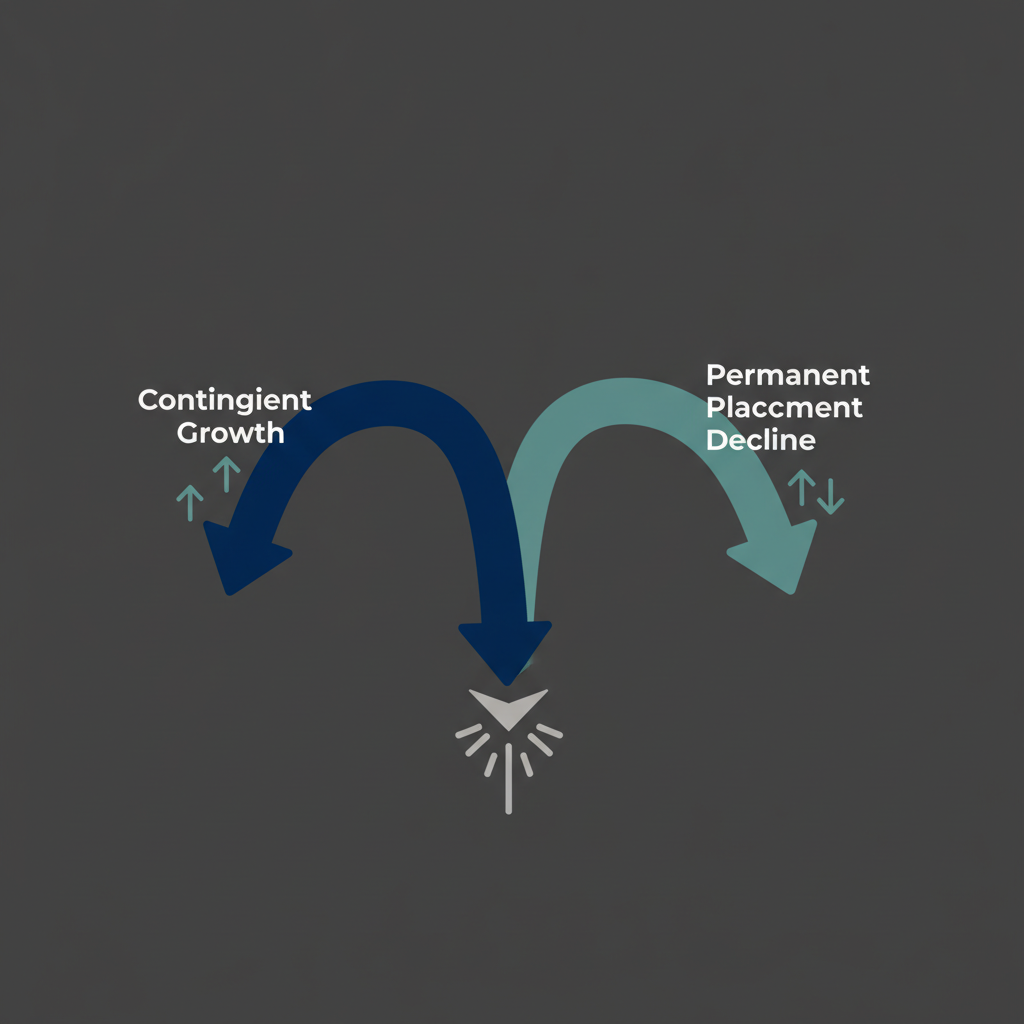
Recruitment metrics show that contingent hiring now dominates boutique agency priorities, with nearly 50% of owners naming it their primary model in 2024.

Recruitment metrics are how boutique agencies decide where to spend their BD time. Right now, most of those metrics are pointing in the wrong direction. The Recruiterflow 2026 benchmarking data shows that almost 50% of agency owners named contingency recruitment their primary model in 2024, and the structural reasons behind that shift are accelerating, not stabilising. If your BD strategy still treats contingent and permanent placement as broadly equivalent opportunities, the recruitment metrics you track are probably misleading your team about where the real client demand is building.
Why Contingent Demand Is Reshaping Recruitment Metrics Across Sectors
Contingent hiring is no longer a stop-gap. According to industry forecasts cited by Mark James Search's EMEA Contingent Workforce Landscape report, contingent talent could make up as much as 40% of the total workforce in many European markets as employers blend permanent headcount with temporary expertise. That is a structural shift, not a cyclical one, and it changes which recruitment metrics actually predict your next placement.
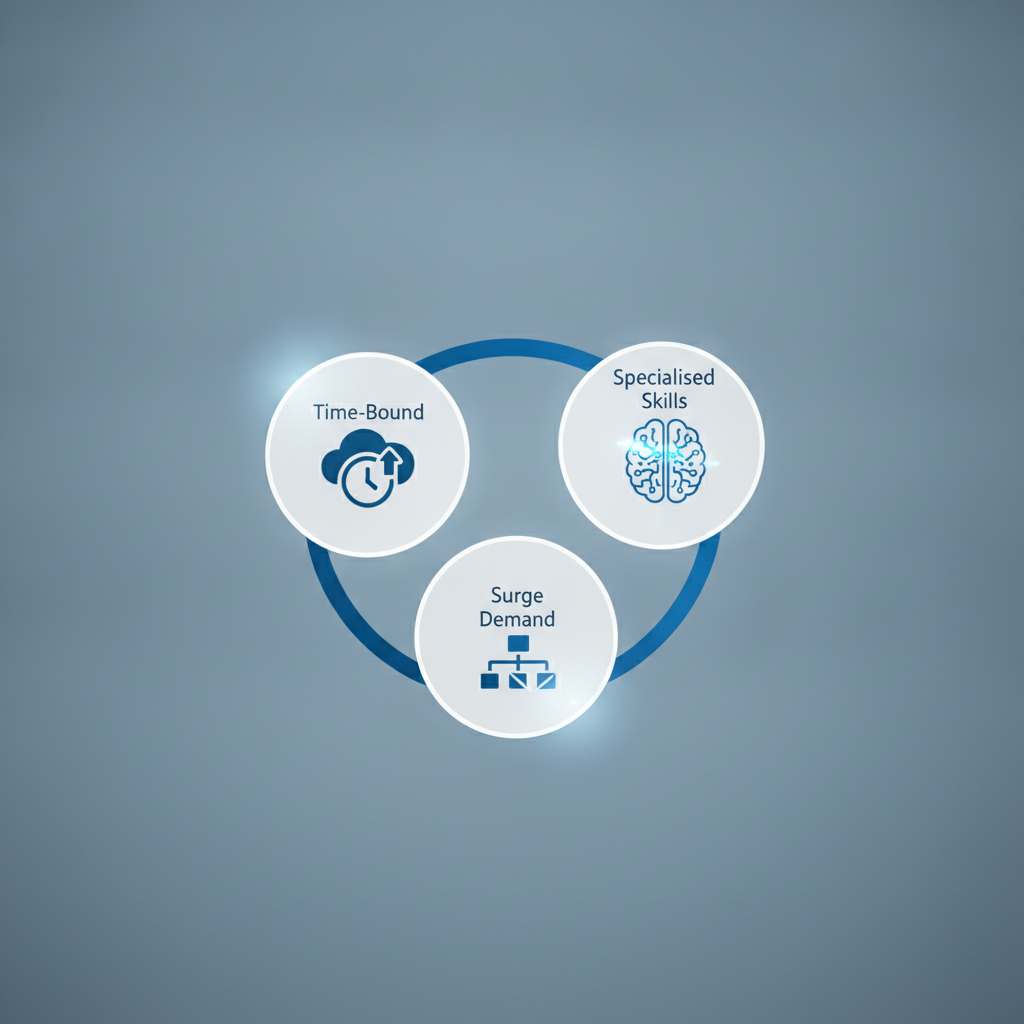
The demand pattern is clear across sectors. According to Artech's 2025 contingent workforce strategy analysis, the roles driving contingent volume share three characteristics: they are time-bound, they require scarce or fast-evolving skills, and they respond to surge conditions. Cloud architects, AI modellers, cybersecurity testers, and KYC remediation analysts are now placed contingently as standard in financial services. The same pattern applies to renewable energy, logistics, and life sciences across the EMEA region.
For a recruitment agency owner, this matters because contingent demand signals arrive earlier and more consistently than permanent hiring intent. A company entering a cloud migration cycle or a regulatory remediation project will need contingent specialists for 12 to 24 months. That is a long runway of repeat business if you identify the need before your competitors do. The recruitment metrics most agencies track, such as total placements and time-to-fill, will not surface this opportunity. They report what happened, not what is about to happen.
The Recruitment Metrics Most Agencies Track Are Backward-Looking
The standard ATS dashboard reports outcomes: placements made, revenue billed, mandates closed. These are lagging indicators. As Yena's 2026 recruitment analytics guide puts it, by the time a problem shows in those numbers, it is usually two to four weeks old. If your submit-to-interview rate fell from 40% to 22% last month, you are seeing the result of a shortlisting failure that happened six weeks ago. The same logic applies to BD. Tracking how many contingent placements you made last quarter tells you nothing about which companies are entering a contingent hiring cycle right now.
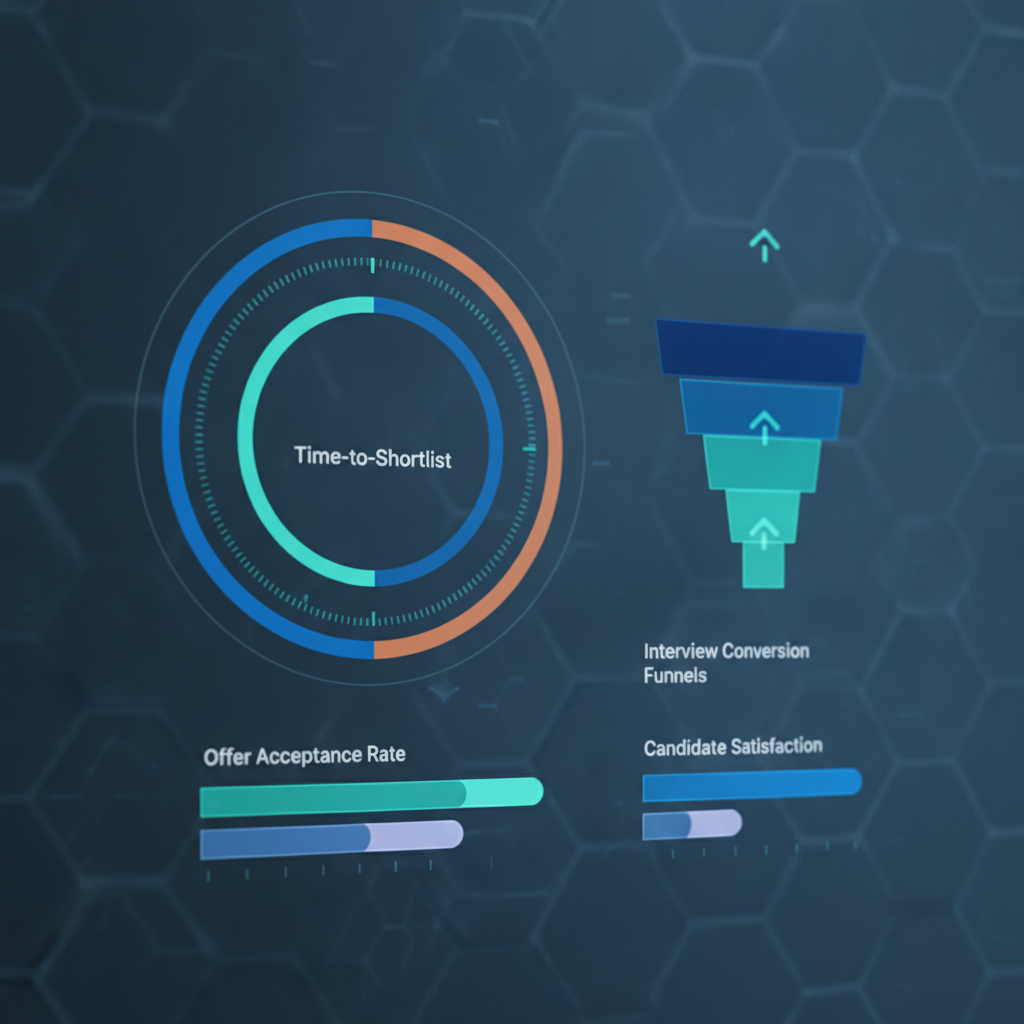
The recruitment metrics that predict future contingent revenue are different. Time-to-shortlist is the single most controllable leading indicator for boutique agencies. For contingency and mid-market roles with a strong existing database, delivering a first shortlist within 24 to 48 hours is achievable. If your average time-to-shortlist for contingent mandates is running above seven days, you will lose a material proportion of those mandates to faster-moving competitors. Track this per mandate type, not as an aggregate, because a high overall average can obscure a contingency desk that is genuinely performing.
Submit-to-interview rate is the second recruitment metric worth monitoring closely for contingent BD. A rate consistently below 33% signals one of three problems: an inadequately qualified brief, a weak candidate pool for that skill set, or a mismatch between what you are presenting and what the client actually needs. A rate above 60% on a specific mandate type, by contrast, usually indicates either an exceptionally well-qualified brief or a trusted-adviser relationship worth protecting. Both are worth knowing. Neither shows up in a standard placements dashboard.
Agencies running contingent desks also need to monitor placement fall-off rates, specifically early drop-outs within the rebate period. Yena's data indicates this number runs between 8% and 15% for most contingency agencies. At 12% fall-off on 50 placements a year, you are losing 6 placements worth of fee revenue. With an average placement fee of around €8,000, that is €48,000 disappearing before it reaches the invoice. That is a recruitment metric with a direct commercial consequence, and it is almost always underreported because it is uncomfortable to face.
Contingent BD Signals: What to Watch Before the Brief Arrives
The most valuable window for contingent BD is the period before a company formally begins recruiting. Companies entering a cloud migration, a regulatory programme, or a surge-driven operational cycle will show external signals of that intent weeks before they brief a single agency. Funding announcements, leadership changes, technology adoption announcements, and headcount growth patterns all predict contingent hiring need. This is the core principle behind hiring intent signals, which are AI-analysed market indicators that identify companies entering their hiring window 20 to 30 days before job postings appear. That predictive window is where recruitment agencies with a proactive BD approach win mandates before competitors even know the opportunity exists.
The sectors driving contingent volume right now are identifiable in advance. The Artech analysis highlights AI, data engineering, and cybersecurity as skills in chronic short supply across banking, insurance, and professional services. The Mark James Search EMEA report points to renewable energy, life sciences, and logistics as growth areas for contingent hiring across Europe. Agencies specialising in these verticals can build a targeted watch list of companies showing growth or transformation signals, and make contact before the brief is written. That is a different BD motion from monitoring job boards, and it produces a different result. For a deeper look at how sector-specific signals vary, how hiring signals differ in IT, finance, and MedTech maps the patterns across three of the highest-volume contingent sectors.
Predictive intelligence platforms like Recruit Signals translate these signals into a ranked Heat Score, showing which companies are most likely to need recruitment services in the next 20 to 30 days. For a contingent desk managing multiple open positions across several clients, that kind of prioritised outreach list replaces hours of manual research with a directed BD queue. The recruitment metrics that matter for contingent BD, specifically response rates and first-meeting conversion, improve when outreach arrives at the right moment rather than at random.
Contract-to-Hire Conversion: The Recruitment Metric That Defines Long-Term Value
Contingent hiring is not just a volume business. The contract-to-hire conversion rate is one of the most commercially important recruitment metrics a contingent agency can track, and the industry baseline is worse than most agency owners realise. According to AList Professionals' analysis of 500+ contract-to-hire placements across IT, engineering, and government sectors, the industry standard conversion rate sits at 27%, meaning 73% of contract-to-hire placements fail to result in a permanent role. Most of those failures happen in the first 30 days and are caused by communication breakdowns, not skills gaps.
The same analysis found that agencies implementing a structured three-touch protocol in weeks one, two, and three of a placement saw average conversion rates reach 65%, alongside 23% higher client retention and a 41% reduction in candidate drop-off. Those are recruitment metrics with direct revenue consequences. A higher conversion rate on contingent placements means more retained client relationships, which is the most cost-effective source of repeat contingent mandates. For the locum and healthcare staffing market, Residency Advisor's locum-to-permanent conversion data shows a similar dynamic: assignments of three to six months convert to permanent roles at roughly 10%, while those running six months or longer convert at around 15%, underscoring how assignment length directly shapes long-term placement value.
Client retention in contingent recruitment follows a similar logic. A retention rate above 80% is a reasonable target for contingency agencies, according to the Recruiterflow benchmarking data. Agencies that monitor retention as an active recruitment metric, rather than an outcome to review annually, spot client disengagement early enough to address it. That connects directly to the BD argument: a contingent client who renews is cheaper to keep than a new one to win. The case for prioritising client retention over new acquisition applies with particular force in contingent markets, where the same client can generate repeated mandates across a multi-year transformation programme.
How to Align Your BD Recruitment Metrics With the Contingent Surge
The practical shift for boutique agency owners is to treat recruitment metrics as a forward-looking BD tool, not a backward-looking management report. Three changes have the most impact. First, move time-to-shortlist to the centre of your weekly reporting. It is the one metric almost entirely within your agency's control, and it directly determines whether you win competitive contingent mandates. Second, track submit-to-interview rate by client and by consultant, not as a global average. The aggregated number hides the signal. A specific client with a persistent low rate is telling you something about brief quality or relationship depth that your overall figure will never surface. Third, measure and report placement fall-off explicitly. If your agency is at 12% fall-off on contingent placements, that number belongs in your monthly review alongside fee revenue.
On the BD side, the most important shift is from reactive to predictive outreach. Companies that are entering contingent hiring cycles give observable signals before they brief anyone. Monitoring those signals, and making first contact in the 20 to 30 day window before active recruiting begins, is now the differentiating BD motion for agencies competing in high-volume contingent sectors. The 20-day advantage that separates signal-led BD from job board monitoring applies to contingent mandates as much as to permanent ones. When the company has already shortlisted three agencies, your recruitment metrics no longer matter. Getting there first is the only BD metric that counts.
Frequently Asked Questions
What recruitment metrics should contingent-only agencies prioritise over placements data?
Contingent agencies should prioritise time-to-shortlist, submit-to-interview rate by client, placement fall-off rate within the rebate period, and contract-to-hire conversion rate. These are leading indicators that predict future placement success and client retention. Lagging metrics like total placements and billed revenue only tell you what already happened, not where the pipeline is about to break.
How does the contract-to-hire conversion rate benchmark compare across contingent sectors?
The industry standard contract-to-hire conversion rate is 27%, according to AList Professionals' analysis of over 500 placements across IT, engineering, and government sectors. Agencies using structured weekly communication protocols with both candidate and client during the first three weeks of a placement report average conversion rates of 65%. The gap between those two figures represents significant lost fee revenue for agencies that do not actively manage the post-placement relationship.
How large a share of the European workforce is contingent in 2025?
Industry forecasts cited in the Mark James Search EMEA Contingent Workforce Landscape report indicate contingent talent could make up as much as 40% of the total workforce in many European markets. Growth is concentrated in technology, renewable energy, life sciences, and logistics. This level of contingent penetration makes it a strategic consideration for workforce planning, not a secondary option.
Why do most contingent placement fall-offs happen, and how should agencies track them?
Placement fall-offs in contingent recruitment, meaning candidates who leave within the rebate period, typically stem from inadequate onboarding alignment, unclear role scope, or unresolved expectation gaps between candidate and client. Yena's 2026 recruitment analytics data puts the typical fall-off rate between 8% and 15% for contingency agencies. Agencies should track this per consultant and per client account rather than as an overall average, because the pattern almost always concentrates around specific brief types or client relationships.
What signals predict contingent hiring need before a company posts a role?
Funding announcements, leadership changes, technology adoption decisions, and headcount growth patterns all predict contingent hiring need in the weeks before a company begins actively recruiting. Regulatory changes, such as the UK's IR35 reforms or new compliance requirements in financial services, also drive predictable spikes in contingent demand. Agencies that monitor these signals can make first contact during the predictive window before competitors receive a brief.
Is a submit-to-interview rate of 33% acceptable for a contingent desk?
A submit-to-interview rate below 33% consistently signals a problem, according to Yena's recruitment analytics benchmarks. The issue is usually one of three things: the brief was not properly qualified, the candidate pool is too thin for that skill set, or the agency is over-submitting to compensate for uncertainty. A rate above 60% on a specific mandate type typically indicates either a very well-qualified brief or a strong trusted-adviser relationship. Both thresholds are worth tracking per client, not as a global figure.
How should boutique agencies track contingent BD performance separately from permanent placement performance?
Boutique agencies should maintain separate pipeline reporting for contingent and permanent mandates, with distinct time-to-shortlist benchmarks for each. The Yena benchmarks suggest 24 to 48 hours for contingency and mid-market roles with a strong database, versus three to five working days for retained executive search. Mixing these in a single average hides meaningful performance differences. BD conversion metrics, specifically first-meeting to mandate rate and mandate to placement rate, should also be tracked separately because contingent clients often move faster and have different qualification signals than permanent hiring clients.


